

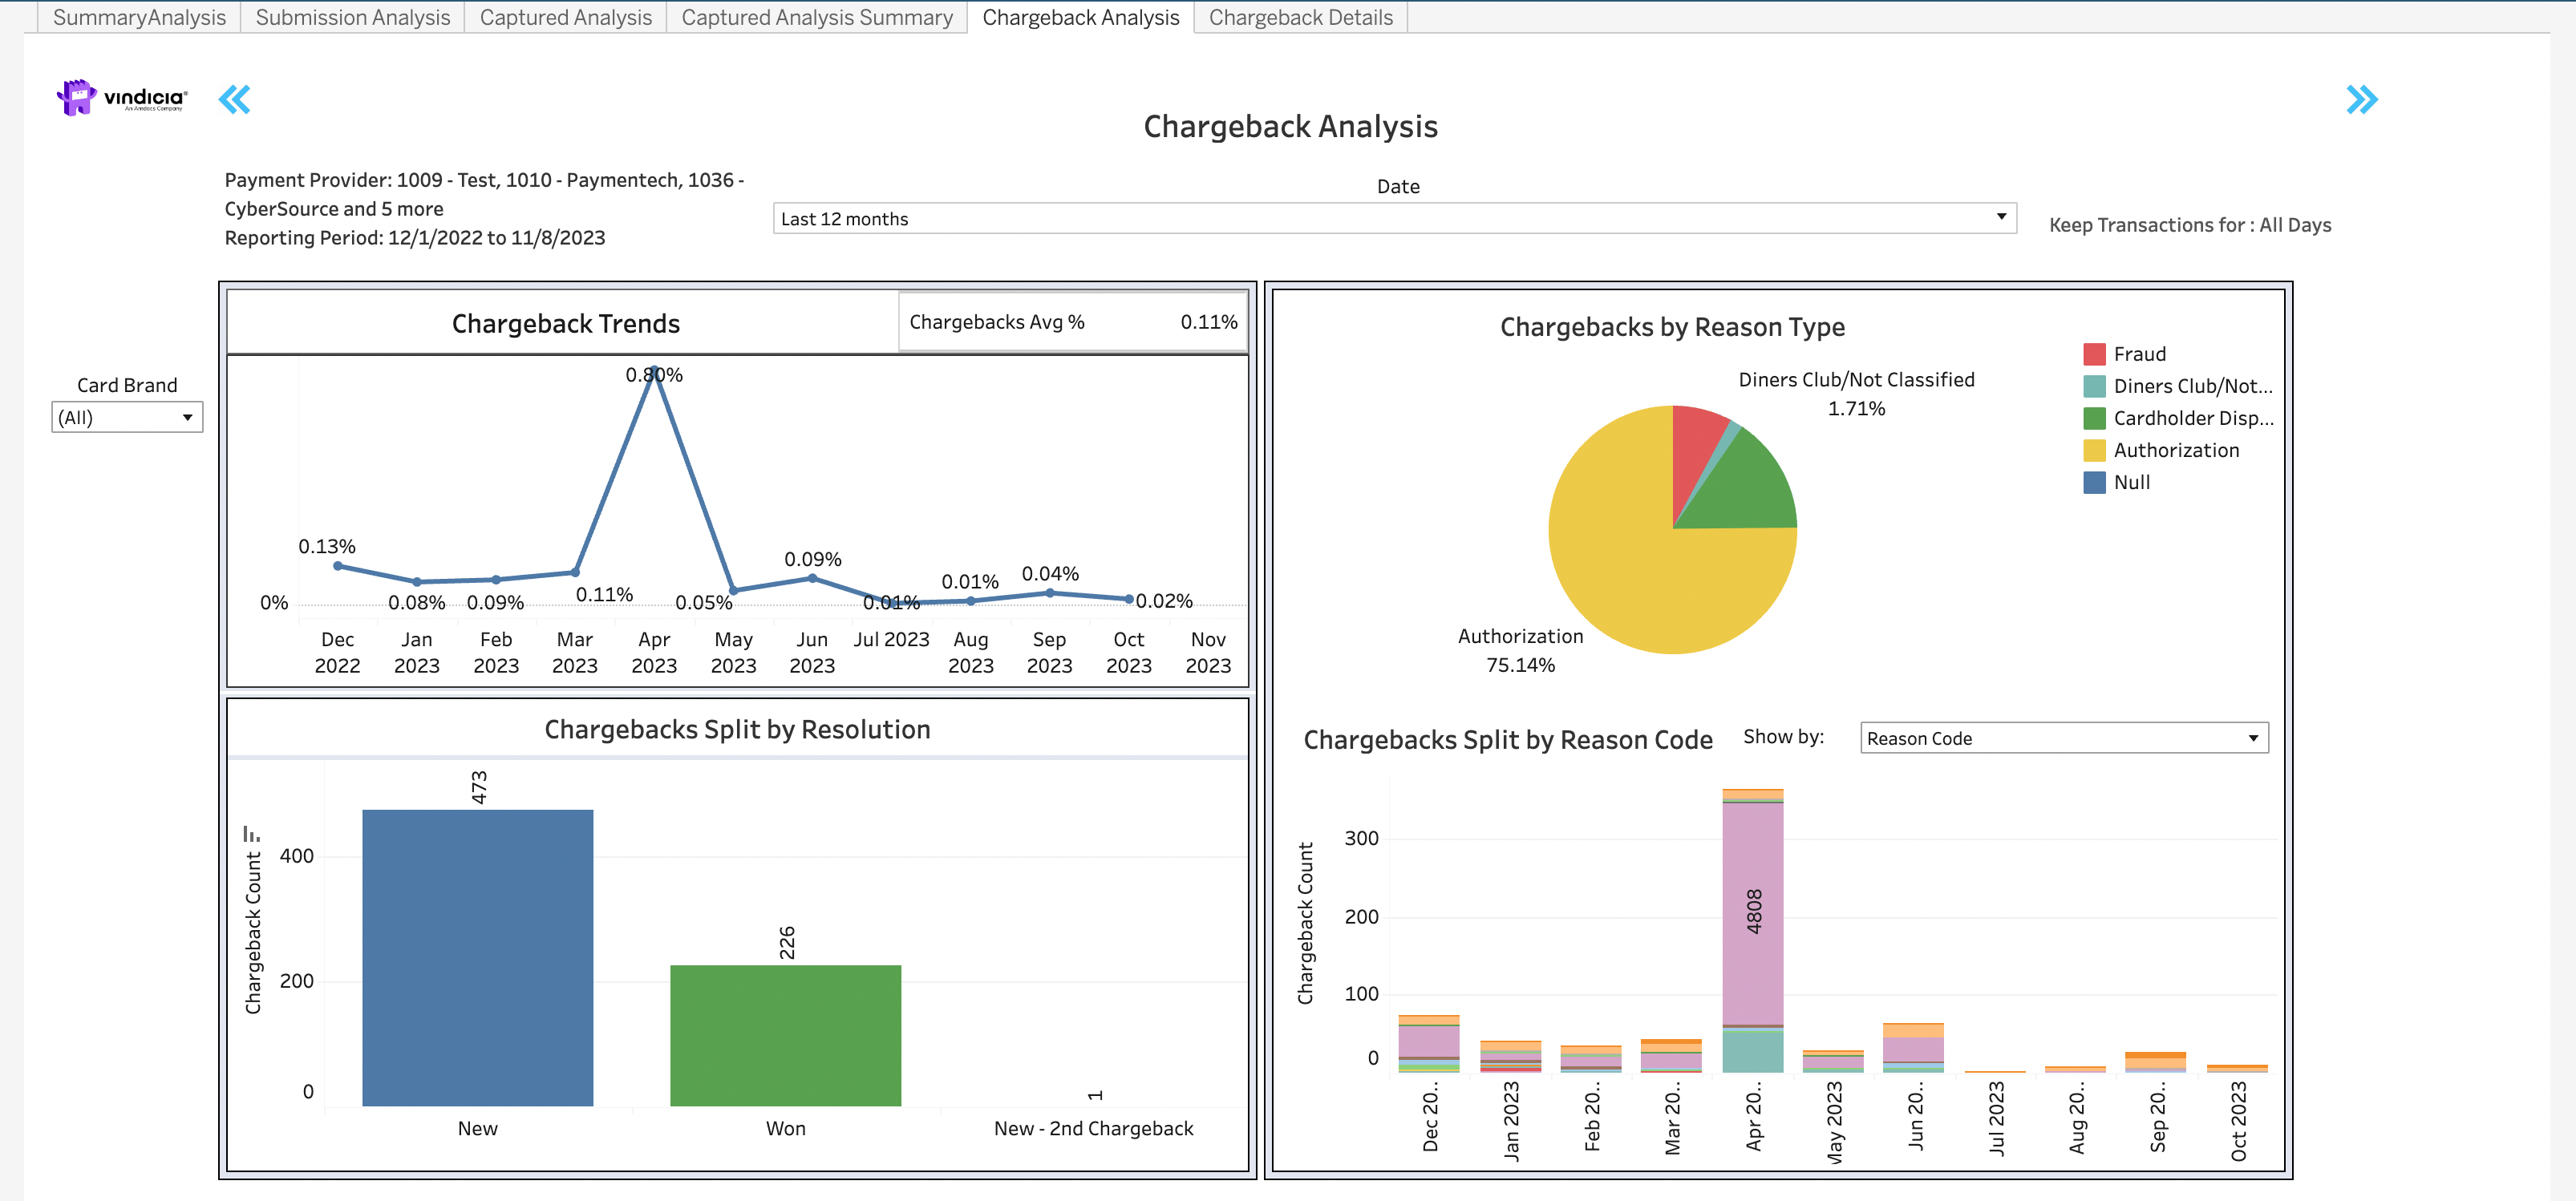
- Chargeback Trends visual diagram - shows the trends of chargeback percentages per month. The chargebacks are displayed based on the transaction captured period not the month the chargeback was filed. Meaning that if a chargeback is received in September for a transaction recovered in July, it will impact the chargeback rate for July.
- Chargeback Split by Resolution chart - provides the breakdown of chargebacks by their terminal status, whether newly received, won back, or appealed.
- Chargebacks by Reason Type pie chart - groups the chargebacks that were filed by the industry based categories for reason types. The reason type grouping by reason codes are detailed in the Chargeback Details tab.
- Chargeback Split by Reason Type - shows a monthly view of the chargeback grouping by the industry based reason types.
Directions
- Hover over any month in the graph to see a pop-up data box with the monthly details.
- Current month displays data up to date 3 days ago. Often this displays partial month revenue and so data may be lower than expected.
- Reporting Period Slider:
